
Managing Supply Chain Risks Using Relational Risk Analysis
By Mark F. Witcher, Ph.D., biopharma operations subject matter expert

Supply chains (SCs) come in a wide variety of forms in the bio/pharma and medical device sectors, ranging from supplying manufacturing operations with material from a warehouse to moving high-value products from manufacturing facilities to patients. SCs require a variety of systems and processes, from picking material from racks, moving material using everything from pallet lifts to airplanes, to complex testing and release procedures.
Although SCs can be very complex,1 this article describes a simple and effective method of identifying, analyzing, and managing the risks for any SC. Because SCs are composed of straightforward processes, their risks can be easily modeled, understood, and managed using relational risk analysis (ReRA).2
SC risks are best modeled as benefit risk sequences that start with an initiating event that triggers the movement of material from an origin or source to the supply chain’s destination. Procedures are another excellent example of benefit risks.3
Setting Up The Relational Risk Analysis Using A System Risk Structure
The ReRA begins by building a system risk structure (SRS) of the events and systems that describes the path from the initiation of the sequence to the final consequence or objective. ReRA defines a system as a process, mechanism, or sequence of steps by which an input event produces an output effect or consequence event. The system can include procedures, people, equipment, or anything else required to take the input and produce the output objective.
SRS development begins by identifying the first and last events, followed by any significant intermediate events. The events are then connected by functional mechanisms (systems or controlling processes) to provide a continuous sequence. For demonstration purposes, this article will use the SC SRS shown in Figure 1.

Figure 1: Simple Supply Chain SRS from the identification of a need for material to its delivery at the destination. By convention, events are numbered and systems are assigned a letter. Intermediate event 3 between B and C and event 4 between C and D are not shown. Each of the four systems may be subdivided as appropriate to provide a more robust ReRA.
For this article, all four subsystems are modeled as benefit risks. Benefit risks require maximizing the probability of achieving the final objective by maximizing the probability of each subsystem successfully achieving its intermediate objective to make the entire SC sequence successful. The table in Appendix A is used to describe the probabilities associated with benefit risks.
The primary event/system flow for the example in Figure 1 is described by the following events and systems:
- Need event – The need for material initiates the SC with a request event to an order generation system.
A. Request System – When a need is identified, the system makes a request to the source to provide material with an order event.
- Order event – A request for material is received by the source to initiate the transfer of material to the destination.
B. Source Handling & Shipping System – Material is acquired, usually from an inventory and delivered to the transportation system. Ancillary tasks modeled as subsystems might include picking, packaging, documenting, and loading the material onto the transportation system.
C. Transport System – The system that physically moves the material from the source to the destination. This system can be composed of many steps involving a wide variety of vehicles, equipment, people, and intermediate events that might add many additional sub-risks, especially those that might cross borders between countries.
D. Destination Receiving & Handling System – The system that takes the material from the transportation system and places it at the final location.
- Delivery event – The material is successfully delivered to its destination, achieving the final objective of the SC.
Any of the systems can be divided into subsystems to increase the resolution of the analysis to deal with any critical or difficult subsystems. For example, the transport system might include one or more intermediate transfer points for changing modes of transportation. In some cases, the destination system may include important sampling, testing, and quality release mechanisms that can be identified and included in the analysis as subsystems.
As is the case with any risk, success and failure need to be defined. To define success, the subject needs to be clearly identified to establish the criteria required for material being successfully received by the next step, including the final destination.
Identifying The Supply Chain’s Subjects
For a supply chain, the primary subject is the material being transferred. The material can range from a sheet of paper or email to complex, potentially very sensitive biological cells or molecules. Clearly understanding and defining what success and failure mean are essential to defining and understanding the SC’s risk systems and how they must be designed, operated, and managed.
In the case of bio/pharma materials, success comes from delivering material that meets a well-defined specification. The attributes of the specification might include purity, exposure requirements, and, in some cases, a defined set of critical quality attributes (CQAs).
However, with some materials, a chain of environmental and custody controls must also be maintained and documented over the entire period from source to destination in order for the material to be acceptable. Failure of control results in the failure of the supply chain. In addition, the material could become contaminated by other products or environmental contaminants. These other risks, if significant, can be analyzed as harm risks to the material being transferred.2
Although not covered in this article, ReRA also can be used to analyze additional harm risks for other subjects that come in contact or manage the material. These subjects could include personnel, equipment, and the surrounding environment. Should any of these risks occur, the SC may not be deemed to have been successful. Future articles will address how to identify and analyze the wide variety of harm risks that could impact the SC’s success.
Analyzing And Managing A Supply Chain’s Systems
Supply chains are indeed chains. The links in the chain are individual systems that receive an input event and produce an output event. The chain is as strong as its weakest link because if one link fails, the SC fails. After the chain has been identified, each system link in the chain must be evaluated to understand and estimate the probability of each link’s success as well as identify secondary factors that could significantly impact the performance of each link. Figure 2 shows the ReRA benefit risk structure for each SC system.2
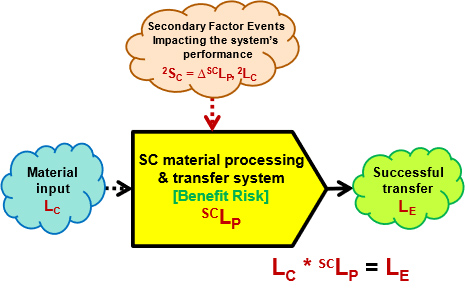
Figure 2: ReRA model for analyzing each system in an SC. Most SC systems or processes are best analyzed as benefit risks where the goal of the system is to maximize the probability of achieving the system’s objective.2
Figure 2 uses the following symbols:
- LC – Probability of a cause, command, initiating event, or situation to execute the system. In many cases, the SC system is initiated deliberately, thus the probability of the initiating event is certain LC = 1.
- LE – Probability of the system achieving its objective.
- SCLP – The baseline design probability of the SC system or mechanism achieving its goal or objective.
- ΔSCLP – The amount SCLP is changed by a secondary cause event or factor, should it occur. The ΔSCLP is the impact severity 2SC on the system of the secondary risk event.
- 2LC Probability of the secondary cause event or factor occurring.
The probability of achieving the objective LE is calculated as the mathematical product of SCLP and LC, thus for most supply chains the probability of LE = SCLP.
Combining the basic structure of a risk shown in Figure 2 with the example SC’s SRS shown in Figure 1 results in the SRS shown in Figure 3.
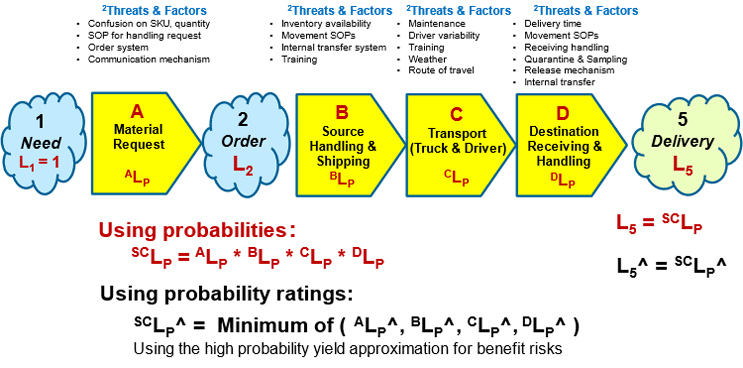
Figure 3: After estimating the baseline performance probabilities of each subsystem as designed, the overall baseline SCLP can be estimated. (Intermediate event 3 between B and C and event 4 between C and D are not shown.) Using the first equation below the figure, the probability of the overall SC risk’s success (SCLP) is the product of the individual subsystem’s XLP’s. If probability ratings from Table A in Appendix A are used, the overall SCLP^ is approximated by the second equation as the minimum value (the weakest link in the chain) of the system sequence.
As shown in Figure 2, a risk system is modeled to have two sources of uncertainty. The first is the uncertainty of the SC’s design as reflected in the probability SCLP of delivering acceptable material. However, for many risks, the greatest uncertainty to the SC’s systems comes from a variety of secondary factors in the form of secondary threats or long-term events called situations or hazards that can degrade the SC’s performance by ΔSCLP^.
While secondary factors, as ReRA models them, cannot cause the primary effect event, they can significantly change the probability of the SC’s success SCLP^, making it look to a casual observer like it caused the primary effect or consequence. For example, a major weather event might significantly change the probability of the transportation system achieving its delivery objective.
Identification, Analysis, And Management Of Secondary Factors
For many risk analyses, the most important activity of a ReRA is to identify and control secondary factors that might significantly impact the performance of one or more of the risk’s systems. In many cases, the SC’s systems are well designed and function properly until a secondary threat event compromises the system greatly, increasing the probability of the system’s failure. The SRS in Figure 3 shows a few of the secondary risk threats and factors that might impact the performance of each primary system.
For secondary factors and threats with low uncertainty or minimal impact, the primary systems can be designed to handle them effectively. For secondary threats with high uncertainty or high impact, separate control systems in the form of additional capabilities or procedures can be added as secondary risk systems as described below.
Important secondary events can be modeled as a consequence of a risk relationship using the same form of primary risks that are modeled in Figure 1. The basic ReRA risk structure provides a powerful tool for understanding and controlling secondary threats.
Figure 4 is an expanded ReRA SRS that includes modeling secondary threats as risk relationships that include a secondary risk system.
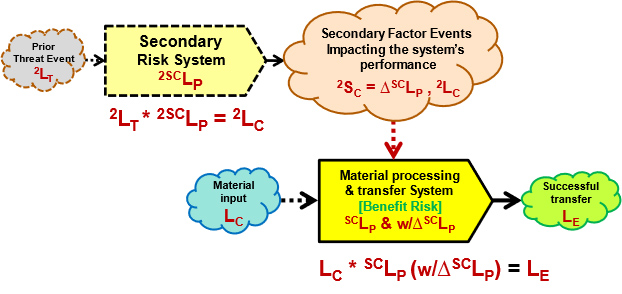
Figure 4: Figure 4 adds a secondary risk to the primary risk. Secondary cause events to the primary system come from secondary threats passing through a secondary risk system. Effective secondary risk systems can be used to control the probability of the secondary cause impacting the primary system.
Figure 4 uses the following additional secondary risk symbols:
- 2LT – Probability of a secondary threat to a secondary control system. If the secondary threat is a situation or condition, then 2LT = 1 (certain).
- 2SCLP – Probability of the secondary system propagating the secondary threat to result in the secondary cause event to the primary system. As is the case with all risk relationships, 2LT * 2SCLP = 2LC.
- 2LC – Probability of a secondary cause event occurring to the primary system.
- 2SC – The severity of the secondary event to the primary system is the amount of change it might induce in the primary system’s SCLP as ΔSCLP.
If a primary system is vulnerable to a particular secondary threat, then the probability of the threat can be controlled by adding a secondary control system as shown in Figure 4. The probability of the secondary threat event 2LC to the primary system is controlled by 2SCLP. By including the uncertainties of both primary cause events LC and secondary events 2LC, a more robust model is possible. The approach shown in Figure 4 results in SRS models that are networks.
A ReRA would begin by estimating the baseline SCLP of each system. These estimates can be highly subjective and include everything from wishful thinking to biased estimates not based on reality. The more information, knowledge, and experience used by the team making the estimates, the better the estimates are likely to be. The second step is to identify and then estimate the secondary threats or opportunities that might degrade or improve the ΔSCLP of the risk’s system. Again, the estimates are likely to be very qualitative unless based on a significant amount of data and experience. In many cases, just the identification of the secondary factor can have a beneficial impact on the results of the SC’s risk analysis.
For example, a secondary factor to the transportation system might be the secondary threat of a tired driver. The tired driver threat can be controlled by including a requirement that the driver rest before or during the trip to reduce the likelihood of it threatening the performance of the transportation system.
While an annotated SRS as shown in Figure 4 can be used to document a ReRA, other methods also can be used to communicate the analysis’s results.
Documenting A ReRA
Because ReRA focuses on the risk’s systems and their probability of propagating the cause events, the number of parameters that must be estimated is both small and well defined. If the probabilities are described as simple rating values as described in Appendix A, the discussion can be further simplified.
After the risk is structured, the estimating starts by evaluating each system and determining its baseline probability rating of success SCLP^ using the available knowledge of the system. The second step is to identify the secondary factors ΔSCLP^ and 2LC^ that can either threaten to degrade the system’s SCLP or improve the system’s performance.
Table 1 shows a risk register (RR) for the SRS shown in Figure 3. The focus is on the SC’s systems SCLP^s shown in the third column followed by the secondary factors in the fourth column. For brevity, the secondary factors are only subjectively identified in Table 1. A more quantitative analysis would include estimates of ΔSCLP^ and 2LC^ along with appropriate rationales, supporting data, and information for each secondary factor.
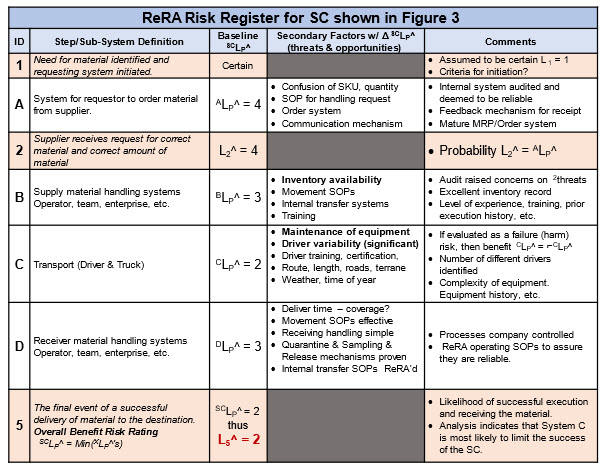
Table 1: ReRA risk register (RR) for SRS shown in Figure 3. RR shows the team’s consensus of the probability ratings based on a review of the systems and the secondary factors that might impact the performance of each system. Probability ratings shown are based on Table A in Appendix A.
Once everyone becomes familiar with ReRA’s format, lexicon, and the probability table shown in Table A, the RR and SRS become relatively straightforward communication tools for discussing the SC’s risk and the team’s estimates. For important risks, the RR/SRS can be expanded to include the necessary level of detail to fully understand, analyze, and communicate the SC’s risk.
ReRA focuses on estimating SCLP^s and possibly a few LC^s. Of course, estimating these values presents many challenges, but the simplicity focuses the estimating on a few parameters that can be readily identified and analyzed by the risk analysis team. If a “do the best you can” approach is taken that includes gathering as much information, data, experience, and knowledge as possible, the SC’s risk can be reasonably evaluated, managed, and accepted based on achieving an ALARP (as low as reasonably possible) criteria for the SC’s probability of success.
Summary
ReRA focuses a risk analysis on the risk’s mechanisms of action or systems. Once the primary system risk sequence is identified, then each system can be designed to have a high probability of successfully achieving its individual objective contributing to making the entire supply chain successful in reaching the final objective of delivering acceptable material.
While structuring a risk into a sequence or network SRS of events and systems is important, frequently the most important activity for a ReRA is identifying and understanding the secondary factors, especially the secondary threats, that might significantly decrease the supply chain’s probability of success.
References
- Stanton, D., Supply Chain Management for Dummies, Wiley & Sons, 2023
- Witcher, M.F., Relational Risk Analysis For The Bio/Pharma Industry, BioProcess Online, January 29, 2024, https://www.bioprocessonline.com/doc/relational-risk-analysis-for-the-bio-pharma-industry-0001
- Witcher, M.F., Controlling procedure failures, including operator errors, in the bio/pharma industry, February 15, 2024, https://www.bioprocessonline.com/doc/using-relational-risk-analysis-to-control-procedure-failures-in-the-bio-pharma-medical-device-industry-0001
Appendix A: Managing a Risk’s Probabilities
The probability rating scale from ≥ 7 (essentially certain) to ≤ -7 (essentially impossible) shown on the right of the table can be used to communicate the probabilities shown in the left.
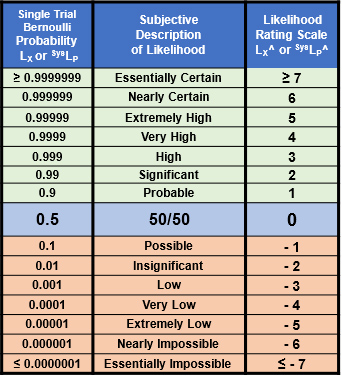
Table A: The range of probabilities from essentially certain to essentially impossible for an event X’s probability of occurrence (LX) and a system’s probability of propagation SysLP. The rating scale LX^ and SysLP^ is also included. The ranges can be extended in either direction as needed. Since there is no certainty, the ratings for LX = 0 or 1 remain undefined.
The LX^ rating scale is symmetric around 50%, with positive ratings for probabilities > 50% and negative values for probabilities < 50%. The probabilistic relationship LX + ¬LX = 1 is equivalent to LX^ + ¬LX^ = 0, resulting in ¬LX^ = – LX^ for translating likelihood ratings between failures and success and vice versa.
About The Author:
 Mark F. Witcher, Ph.D., has over 35 years of experience in biopharmaceuticals. He currently consults with a few select companies. Previously, he worked for several engineering companies on feasibility and conceptual design studies for advanced biopharmaceutical manufacturing facilities. Witcher was an independent consultant in the biopharmaceutical industry for 15 years on operational issues related to: product and process development, strategic business development, clinical and commercial manufacturing, tech transfer, and facility design. He also taught courses on process validation for ISPE. He was previously the SVP of manufacturing operations for Covance Biotechnology Services, where he was responsible for the design, construction, start-up, and operation of their $50-million contract manufacturing facility. Prior to joining Covance, Witcher was VP of manufacturing at Amgen. You can reach him at witchermf@aol.com or on LinkedIn (linkedin.com/in/mark-witcher).