Calibration Procedure For Image AcquisitionVis AGFA Duoscan T1200 Scanner
Calibration Procedure For Image AcquisitionVis AGFA Duoscan T1200 Scanner
General Note:
It is important to set the scanner to Density mode. In order to achieve maximum dynamic range and best fit calibration curve, the settings below have to be maintained during all scans.
Procedure:
1. Slide out drawer for transparencies. Make sure, glass is clean, free of dust particles and fingerprints, otherwise clean glass surface.
2. Insert
Either:
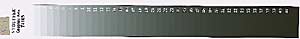
a. Stouffer Transparent Step wedge (No.T 4105C, 41 steps , up to OD = 2)
b. Stouffer Transparent Step wedge (No.T 3110C, 31 steps, up to OD = 3)
c. Stouffer 21-Step Sensitvity Guide (No.T 2115C, 21 steps, up to OD = 3)
into slide-out drawer for transparencies. Gamma-calibrate the monitor to optimize contrat/tones.
3. Start GelExpert 3.5 software. Select "Scanner" icon; Agfa PhotoLook will launch automatically.
4. Upon start of PhotoLook3.0, make sure, that the following Scanner settings are choosen:
- Agfa PhotoLook 3.0
Original: Transparent
Mode: Color (RGB) IMPORTANT! Do not select Greyscale !
Input: 150 ppi
Scale: 100%
Range: Densities
Tone curve: (None)
Sharpness; Medium (30%)
Deescreen: (None)
Flavour: (None)
Press PREVIEW, select area to match the 41step film, then SCAN. The image will be transferred into GelExpert and PhotoLook will close.
Note: When you select Densities the first time, you will be asked for the range. Please set minimum density to the lowest value (left end, ~0.05) and maixmum density to the highest value (right end, ~ 3.0).
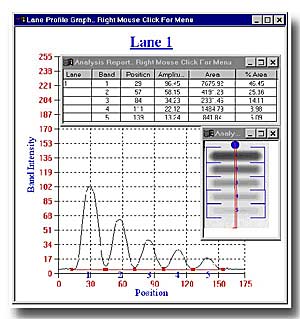
6. Select ANALYSIS, Analysis Type: Dot/Slot Blot ELISA
7. Press BACKGROUND button and specify in dialog:
- Objects are darker than background
- No background subtraction
8. Press TEMPLATE PROPERTIES button
|
For T41 film, set |
For T31 film, set: |
For T21 film, set: |
For T10 film, set: |
|
Size X = 10 |
X = 10 |
X = 12 |
X = 12 |
|
Size Y = 35 |
Y = 26 |
Y = 8 |
Y = 14 |
|
Grid Properties: |
Grid Properties |
Grid Properties |
Grid Properties: |
|
-Rows = 1 |
Rows = 1 |
Rows = 1 |
Rows = 1 |
|
Columns = 41 |
Columns = 31 |
Columns = 21 |
Columns = 10 |
|
Spacing X =10 |
Spacing X = 10 |
Spacing X = 9 |
Spacing X = 14 |
|
Spacing Y = 0 |
Spacing Y = 0 |
Spacing Y = 0 |
Spacing Y =0 |
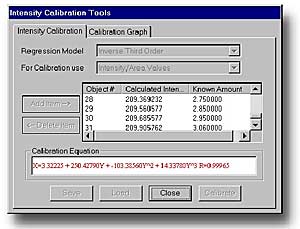
9. Push INTENSITY CALIBRATION button
10. Select Regression Model "Invers Third order"
11. For Calibration, use "Intensity/Area" IMPORTANT! Do not select "Intensity Values"!
12. Use ADD to add step film OD values one-by-one for all gray shades (21/31/41 data points).
13. SAVE calibration curve., then press CALIBRATE. Save Experiment file.
You are now ready to measure absorbances in your protein gels. Use identical scanner parameters to obtain the gel image. When analyzing, use Analysis Module PROTEIN GELS. Press the CALIBRATION button and apply the calibration function obtained in steps 1-12.